In the world of data analysis, the term "Analysis of Variance (ANOVA)" often comes up when comparing multiple groups. Despite sounding technical, ANOVA is essentially a simple statistical method that helps determine whether differences between groups are genuine or just by chance. Imagine you're running an experiment to compare several methods of teaching, fertilizer brands, or diets—ANOVA lets you analyze all these scenarios effectively.
It's a practical tool that simplifies complex data and offers clear answers about your results. This article provides a straightforward explanation of ANOVA, explaining how it works, its various types, when you should use it, and why understanding concepts like the F-value or statistical significance makes your analyses reliable.
How Does ANOVA Work?
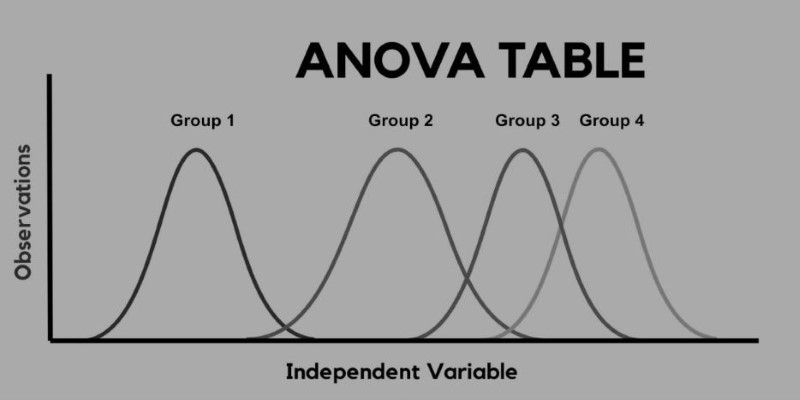
At its core, Analysis of Variance (ANOVA) tests whether the average outcomes across multiple groups differ significantly. It does this by comparing two types of variance: the variance between groups and the variance within each group.
To simplify this further, variance is just how spread out your data points are from the mean or average. ANOVA asks a straightforward question: "Is the variance between the group averages greater than what you'd expect by random chance alone?" If it is, then the differences between groups are considered statistically meaningful.
The essential calculation in ANOVA produces a number called the F-value, a crucial concept in interpreting your results. The F-value measures how much the averages of different groups differ compared to the variability within the groups. A high F-value usually means your groups differ meaningfully. Alongside the F-value, ANOVA generates a p-value, indicating statistical significance. Typically, a p-value of less than 0.05 signals that the observed differences are unlikely due to chance alone.
Types of ANOVA and Their Applications
ANOVA comes in different forms, each suited for specific research designs. Understanding these types—especially one-way ANOVA, two-way ANOVA, and repeated measures ANOVA—will help you choose the correct analysis for your study.
One-way ANOVA
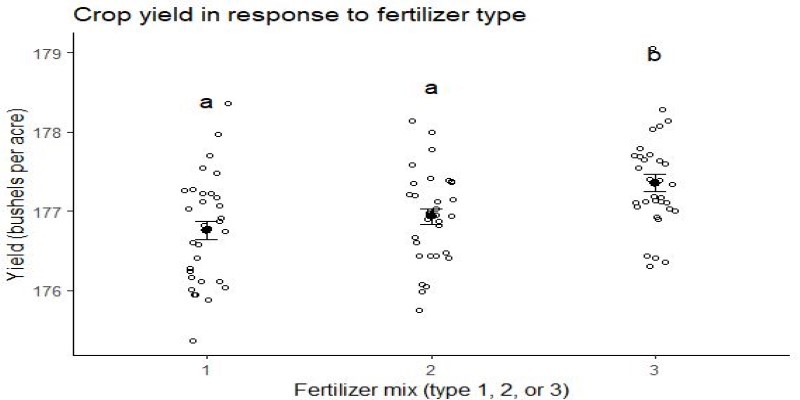
One-way ANOVA is the most basic and frequently used type. It examines one independent variable with three or more groups. Imagine you're comparing the effectiveness of three different teaching methods. One-way ANOVA can determine whether at least one method produces significantly better outcomes than the others. However, if significant differences appear, one-way ANOVA alone can't tell you exactly which groups differ—you’d need follow-up tests to pinpoint those specifics.
Two-way ANOVA
Two-way ANOVA introduces complexity by analyzing two independent variables simultaneously. Suppose you're studying plant growth affected by two different variables: fertilizer type and amount of sunlight. Two-way ANOVA enables you to test not only the impact of each variable individually but also the interaction between them. This method provides comprehensive insights into how multiple factors influence outcomes together, highlighting interactions that simpler analyses might overlook.
Repeated Measures ANOVA
Repeated measures ANOVA is suitable when you're assessing the same subjects multiple times under different conditions. For example, you might track a single group's performance over three different diet plans, measuring their weight loss at each stage. Using repeated measures, ANOVA helps determine if the observed changes across different conditions or times are statistically significant.
Why ANOVA Is Important and When to Use It?
One might wonder why one should choose ANOVA instead of running several simpler tests, like multiple t-tests. The primary advantage lies in accuracy. Performing multiple individual tests increases the likelihood of mistakenly detecting significant differences where none exist—this is known as a Type I error. ANOVA mitigates this risk by comparing multiple groups simultaneously, keeping errors under control.
Additionally, ANOVA is widely applicable in diverse fields like psychology, agriculture, education, and healthcare. Researchers often rely on ANOVA to validate whether their findings are robust and statistically valid. Whether it's comparing student test scores, drug efficacies, or manufacturing methods, ANOVA provides clarity by distinguishing meaningful differences from random variations.
However, ANOVA assumes certain conditions: data should follow a normal distribution, and groups should have similar variances. Violating these assumptions might reduce the reliability of your results. When these conditions aren't met, researchers might need alternative tests or adjustments to the traditional ANOVA method.
Understanding Statistical Significance and the F-value
When using ANOVA, it's essential to clearly understand the practical meanings of statistical significance and the F-value. Statistical significance represents the probability that observed differences between your groups aren't due simply to random chance. A statistically significant result—typically indicated by a p-value below 0.05—means there's less than a 5% likelihood that the differences occurred randomly. Thus, a significant p-value strongly suggests genuine and consistent group differences worth investigating further.
Complementing statistical significance is the F-value, a core component of ANOVA results. The F-value measures the ratio of variance between groups to variance within groups. Simply put, the higher your F-value, the greater the confidence that group differences aren't coincidental but substantial and meaningful. A large F-value signals that the variation among groups exceeds random fluctuations within the groups themselves.
For instance, if your ANOVA test yields an F-value of 5.2 alongside a p-value of 0.01, it strongly indicates meaningful, non-random differences among groups. Researchers depend on interpreting these critical values—the F-value and p-value—to confidently validate results, make accurate conclusions, and ensure reliability in their analyses across diverse research contexts.
Conclusion
Analysis of Variance (ANOVA) simplifies complex data comparisons by identifying meaningful differences among multiple groups. It compares variance between and within groups, using the F-value and statistical significance (p-value) to clarify if observed differences are genuine or random. Whether employing one-way ANOVA, two-way ANOVA, or repeated measures ANOVA, understanding these fundamentals ensures reliable results across fields such as education, healthcare, and agriculture. By reducing potential errors common in multiple comparisons, ANOVA provides clear, data-driven insights. Ultimately, mastering ANOVA allows researchers and professionals to confidently interpret data, guiding informed decisions through robust statistical evidence and making complex analysis straightforward and approachable