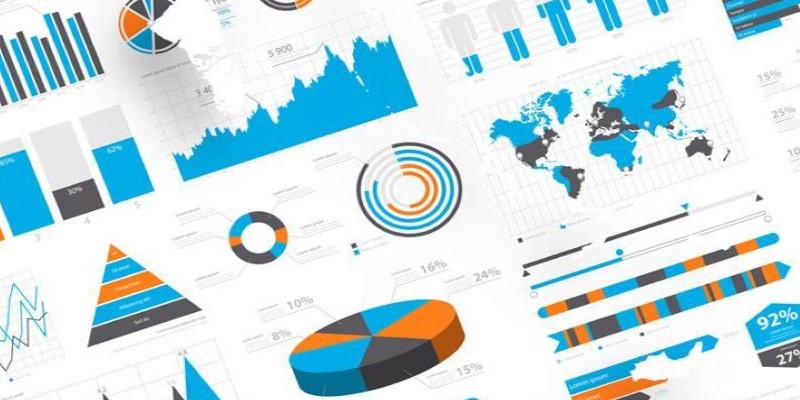
Big data is only valuable when we can extract meaningful insights from it. With the constant flow of data, understanding it goes beyond just numbers and tables. Big Data Visualization Tools are essential for businesses, researchers, and analysts to interpret complex data patterns effectively. These tools convert raw data into visual formats like charts, graphs, and interactive dashboards, simplifying decision-making.
But selecting the appropriate tool is not merely a matter of visuals—it's about finding the right tool for your particular needs, being accurate, and enhancing efficiency. Understanding the types of visualization tools, their advantages, and how to select the most appropriate one can significantly improve data usage.
Types of Big Data Visualization Tools
Big Data Visualization Tools exist in many forms, each suited for a different need of data processing and display. There are tools for static visualizations and others that offer highly interactive dashboards that update in real-time. The selection would depend on the complexity of the data and the degree of detail needed.
Static Visualization Tools

Static visualization tools are easy and efficient. They transform raw information into static charts and graphs, making them perfect for reports and presentations where data is constant. These tools are also great for summarizing past trends and delivering main insights without live interaction.
Interactive Visualization Tools
Interactive visualization tools enable users to view data interactively in real-time. User features such as zooming, filtering, and drilling down on data points maximize user interaction. Such tools benefit business intelligence greatly, as they present decision-makers with real-time interactive insights to guide informed, expedient decision-making in high-velocity settings.
Geospatial Visualization Tools
Geospatial visualization software plots data onto geographic locations, providing location-based insights for analysis. It is applied in logistics, urban planning, and environmental monitoring to visualize spatial relationships and geographical patterns. This tool facilitates easier analysis and comprehension of location-based data and trends.
3D Visualization Tools
3D visualization software adds depth to conventional charts through the introduction of a third dimension. They are particularly useful in areas such as scientific study, medical imaging, and engineering, where spatial relationships between data points are of prime importance. The additional dimension brings out subtle patterns that can go unnoticed in 2D visualizations.
AI-powered Visualization Tools
AI-powered visualization tools leverage artificial intelligence to automatically detect patterns and trends in large datasets. These tools save time and provide deep, insightful analysis without requiring manual intervention. Ideal for industries dealing with unstructured data, they offer real-time insights, uncovering hidden data relationships for more informed decisions.
Benefits of Big Data Visualization Tools
Using the right visualization tools provides a host of benefits beyond just making data look appealing. The primary advantage is clarity—translating raw numbers into easily digestible formats helps businesses and researchers quickly grasp essential information.

One of the most significant benefits is improved decision-making. When data is visualized effectively, patterns and trends become more apparent, allowing businesses to make informed strategic choices. Whether it’s tracking sales performance or monitoring customer behavior, visualization tools provide the insights needed to act promptly.
These tools also enhance data storytelling. Numbers alone rarely tell a compelling story, but visual representations make trends more accessible and engaging. Businesses use visualization to communicate performance metrics to stakeholders in a way that is both intuitive and persuasive.
Another key benefit is the ability to handle large datasets efficiently. Analyzing massive datasets can be overwhelming without visualization. Big Data Visualization Tools simplify this process, enabling users to explore complex relationships within data without needing advanced programming skills.
Collaboration is another major advantage. Many modern visualization tools allow multiple users to interact with and modify dashboards in real-time. This fosters teamwork and ensures that data-driven decisions are aligned across departments.
Additionally, automation features within some tools reduce manual workload. Instead of spending hours generating reports, businesses can set up dashboards that update automatically with the latest data. This saves time and ensures that stakeholders always have access to up-to-date information.
How to Choose the Right Big Data Visualization Tool?
Selecting the right big data visualization tool can significantly impact your ability to analyze and interpret complex data effectively. Each business has unique needs, so it's essential to evaluate various factors before making your choice.
Complexity of Data: Choosing the right tool starts with understanding the data's complexity. Simple datasets may require basic tools, while complex, real-time data necessitates more advanced, interactive solutions for deeper analysis.
Usability: The tool should match the users' skill levels. User-friendly platforms with drag-and-drop interfaces suit non-technical users, while more advanced tools requiring coding are better for experienced data analysts.
Compatibility with Existing Systems: Ensure the tool integrates seamlessly with your current data sources, including cloud storage, databases, and business intelligence platforms, to improve efficiency and simplify data retrieval for analysis.
Customization Options: Customization allows the tool to be tailored to meet specific needs. Some tools offer extensive customization for dashboards and reports, while others provide limited flexibility with preset templates catering to different requirements.
Cost: When choosing a tool, consider your budget. High-end tools provide advanced features but may be costly, while free or affordable versions are suitable for smaller businesses needing basic functionalities.
Security Features: Security is critical, especially when handling sensitive data. Look for tools with encryption, access controls, and compliance with data protection regulations to ensure that your information remains secure.
Scalability: The tool should be scalable to accommodate growing data volumes without performance issues. Ensure it can handle larger datasets and adapt to the business's evolving needs.
Conclusion
Big Data Visualization Tools are essential for transforming complex data into actionable insights. By understanding their types, benefits, and factors to consider when choosing the right tool, organizations can enhance decision-making, streamline data analysis, and improve collaboration. Whether through static charts or interactive dashboards, these tools help businesses make sense of vast datasets, ensuring that data drives informed and strategic actions. The right tool will empower organizations to unlock the full potential of their data.
